For more information on changes in global precipitation, visit: EPA Global Warming Site: Trends
EPA Global Warming Site: Future Climate
Remote
Sensing: Precipitation
Precipitation is a very important part of climate. Precipitation is
the solid, liquid, or gaseous water that falls from the atmosphere to Earth's surface. This includes snow, sleet, hail, rain, and even mist. Changes
in the amount of precipitation falling to Earth affect our lives in many ways. Daily human
activities, business and industry, agriculture, and the environment all require water. Much of Earth's water ultimately
comes from precipitation. Too little precipitation can result in dry soil, shallow streams, and shortages of
municipal water supplies.
However, too much precipitation can also have a negative
impact on human activities, business and industry, agriculture, and the environment. For example, too much rain or snowmelt (water from melted
snow) at one time can lead to flooding. Living organisms, including crops, can drown in floodwaters.
Homes, businesses, even land can be washed away.
 For
these reasons, many scientists have been monitoring precipitation trends.
That is to say, they have been watching changes in the amount of
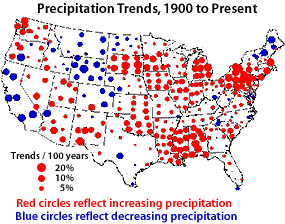
precipitation falling to Earth. In the last 100 years, precipitation has
increased by an average of about 1% over all the land surfaces on Earth.
Across the United States, alone, precipitation has increased by an average
of about 5% in the last 100 years. Note that this is an average. Some
areas of the United States have experienced as much as a 20% increase in
precipitation over the last 100 years (see figure above). While other
areas have experienced a 20% decrease in precipitation.
Map
courtesy of the United States Environmental Protection Agency.
There are many reasons for changes in precipitation. The
leading cause is a change in temperature. Many
scientists believe an increase in temperature could lead to a more intense water cycle. The rates of
evaporation from soils and water, as well as transpiration from plants, could increase. The amount of
precipitation could also increase.
Predicted changes in the water cycle differ according to the region of the planet being examined. Many
scientists believe rates of evaporation will be greater than precipitation in the middle
latitudes such as the United States. This could result in drier summers in these regions.
Of course predicted changes in the water cycle also differ
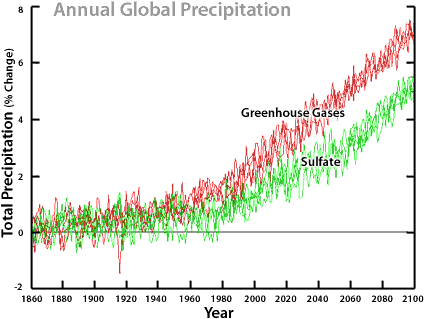
according to the climate model used. The "business as usual" climate model (described
in Remote Sensing: Carbon
Dioxide" assumes climate changes based solely on the effects of greenhouse gases.
Predictions of changes in precipitation based on this model show an increase in the amount of precipitation
falling in the next 100 years (see figure below). Another model includes in its assumptions the effects of
sulfates. Sulfates cause a cooling of the atmosphere. Therefore, sulfates can decrease the effects of
greenhouse gases on temperature. Models of future precipitation that include the effects of sulfates also
show an increase in the amount of rain and snow. However, the increase in precipitation predicted in these
models is not as great as the increase predicted in the "business as usual" models.
Graph courtesy of the International Panel of Climate Change.

Whether or not the amount of precipitation changes, many climate models show that the timing of precipitation will change. Scientists predict that most precipitation in the future will fall during a smaller number of storms that are heavier in intensity. This is because the elevated temperatures will provide more energy in the atmosphere for storm production.
Overview
..|..
Carbon Dioxide ..|..
Temperature
..|..
Precipitation
..|..
Wheat
Glossary ..|..
Related
Links ..|..
References
|..
PBL
Model
Home ..|.. Teacher Pages ..|.. Modules & Activities
HTML code by Chris
Kreger
Maintained by ETE
Team
Last updated November 10, 2004
Some images © 2004 www.clipart.com
Privacy Statement and Copyright © 1997-2004 by Wheeling Jesuit University/NASA-supported Classroom of the Future. All rights reserved.
Center for Educational Technologies, Circuit Board/Apple graphic logo, and COTF Classroom of the Future logo are registered trademarks of Wheeling Jesuit University.
