For more information on changes in global temperature, visit: EPA Global Warming Site: Trends
Remote
Sensing: Temperature
Temperature is a major part of climate. Temperature controls many things, including the availability of
water. In fact, a temperature increase of 5 to10 °F (3 to 6 °C) in the United States could
result in a decrease in soil moisture of 10 to 30 percent during the summer. A decrease in soil moisture
could cause natural vegetation and crops to dry out. This could severely impact the environment as well as
the economy.
Since temperature is so important, many scientists have been studying it. They examine past values and
create climate models to predict future trends in temperature change. Visit
VEMAP Trend Maps to
examine maps of historical temperature data and predicted temperature trends.
Scientists estimate that mean global temperatures have
increased by 0.5 to 1.0 °F (0.3 to 0.6 °C) in the last 100 years. Note that this is an increase in the "mean global" temperature. "Mean
global temperature" refers to the average of all of the temperature changes from
throughout the world. In reality, the temperature change has not been
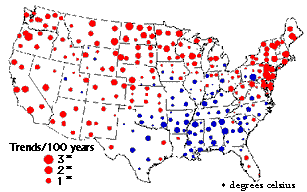
consistent across the planet. In fact, the temperature change has not been consistent across the United States (see map below). In the last 50
years, temperatures in the western United States have warmed. At the same time, temperatures in the
eastern United States have cooled. The cooling in the southeastern United States may be due to excessive
sulfates in the air. Sulfates can scatter the sun's light before it reaches the earth's surface. Without heat
from the sun, the earth's surface will cool.
 The
map at the right displays temperature trends across the United States over the last 100 years. Red
circles represent temperature increases, while blue circles represent
temperature decreases. Large circles represent a 3°C change, medium
circles represent a 2°C change, and small circles represent a 1°C
change. Map courtesy of the United States
Environmental Protection Agency.
The increase in temperature has not been consistent through
time, either. Some periods during the year have experienced greater and faster temperature increases than others. Average winter temperatures in
areas between 50 and 70 ° North latitude have been increasing quickly, while summer
temperatures have hardly changed. Rates of temperature change even vary according to the time of day.
Throughout the world, nighttime lows are rising about twice as quickly as daytime highs.
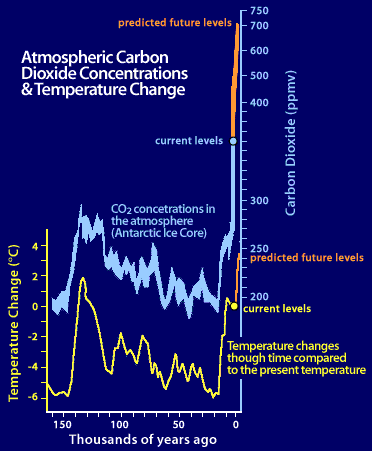
Changes in temperature appear to be closely related to concentrations of atmospheric carbon dioxide (CO2). The figure below displays the concentration of atmospheric CO2 as well as temperature changes observed during the past 160 thousand years and predicted during the next 10 thousand years.

Graph: Atmospheric carbon dioxide concentration (ppmv) and temperature change (°C) observed during the past 160 thousand years and predicted during the next 10 thousand years. Historical carbon dioxide data was collected from Antarctic ice cores; temperature changes through time are relative to the present temperature. Graph adapted from the Whitehouse Initiative on Global Climate Change.
As concentrations of CO2 in the air decrease, so does the temperature. As concentrations of CO2 in the air increase, so does the temperature. Concentrations of atmospheric CO2 are expected to increase dramatically in the future. Even if emissions of CO2 stay the same as they are now, concentrations of atmospheric CO2 will increase to 700 ppm by 2100 (see Remote Sensing: Carbon Dioxide. As a result, mean global temperatures will increase by 3.5 °F (1.9 °C) over the next 100 years.
Overview
..|..
Carbon Dioxide ..|..
Temperature
..|..
Precipitation ..|..
Wheat
Glossary ..|..
Related
Links ..|..
References
|..
PBL
Model
Home ..|.. Teacher Pages ..|.. Modules & Activities
HTML code by Chris
Kreger
Maintained by ETE
Team
Last updated November 10, 2004
Some images © 2004 www.clipart.com
Privacy Statement and Copyright © 1997-2004 by Wheeling Jesuit University/NASA-supported Classroom of the Future. All rights reserved.
Center for Educational Technologies, Circuit Board/Apple graphic logo, and COTF Classroom of the Future logo are registered trademarks of Wheeling Jesuit University.
