
    |
Activity 2: Measuring Environmental Change This set of activities will give your team a quantitative measure of land-use changes around Rio Branco. Area and Linear Measurements Many of the potential land uses that can be considered such as biodiversity preserves or national parks require either minimum areas or linear dimensions to be viable. You can use the area and linear measurement tools in NIH Image to measure remaining undisturbed areas in the Rio Branco region to see if any are large enough to accommodate a specific land use. Remember, the width of the imaged areas in Brazil 1-2 and 2-2 is 185 kilometers. Use the Set Scale command to enable measurement of distances and areas directly in kilometers and square kilometers. If you have forgotten how to use the measuring tools, review the "Strangers in Paradise" image processing activity. Measuring Changes in Land Use You can use the density slice option (see detailed procedures in Image Processing Procedures) to select and measure the area of agricultural land in a square of known size in any of the 1986 images. Then you can measure the area of agricultural land in the same square on the 1992 images and calculate the increase or decrease in agricultural use as a percentage or in square kilometers. You can compare your measurements to population changes around Rio Branco or to changes in land use in other areas of Brazil using the data at the "Amazonia from Space" Internet site, which may be accessed via ETE's Brazilian Landsat Link. You can also use your measurements to predict how fast the rainforest will disappear around Rio Branco. Remember, the larger the area you choose, the more representative your measurements will be. Perhaps the most useful comparisons will be those that use large sections of Brazil 1-2 and 2-2. Size Comparisons Just for fun, you might want to really get a feel for how large the farms and towns are in the Rio Branco images in comparison to your home town and neighboring counties or to see how big the Brazilian farms are in comparison to typical American farms. Both types of activity involve scaling and pasting the Rio Branco images onto other maps or images. Cutting and pasting images (see Image Processing Procedures) is easy, but you need to be careful to enlarge or reduce all of the images you use to the same linear scale. That will require great care and a little work.
This image is constructed by pasting a highly stretched and inverted version of Brazil 1-2 onto a (colored) digital map of the Wheeling area (see Image Processing Procedure). There are at least two ways to make digital maps of your own area in order to make a similar composite: (1) If you have a scanner, you can get a map of your state and scan in a section a few hundred kilometers square (remember the Rio Branco image are about 185 km square). If you live in a small state, you may need to get a regional map. You can then paste the Rio Branco image onto this map file for comparison. (2) You can go to the Xerox PARK map web site and zoom into the map to show the area around where you live. You can then use screen capture to get the outline map file and cut-and-paste to make an outline map as large as you need. You can then color the map as you wish and paste the Rio Branco image onto it.
[ Amazon Rain Forest: View from Space ] [
Seeing Environmental Change ] [ Home ] [ Teacher Pages ] [ Modules & Activities ] |
![]()
Page created by Chris Kreger
Maintained by ETE Team
Last updated November 10, 2004
Some images © 2004 www.clipart.com
Privacy Statement and Copyright © 1997-2004 by Wheeling Jesuit University/NASA-supported Classroom of the Future. All rights reserved.
Center for Educational Technologies, Circuit Board/Apple graphic logo, and COTF Classroom of the Future logo are registered trademarks of Wheeling Jesuit University.
 The composite image to the left
shows how the agricultural areas around Rio Branco compare with the area around Wheeling,
WV (the home of ETE).
The composite image to the left
shows how the agricultural areas around Rio Branco compare with the area around Wheeling,
WV (the home of ETE). 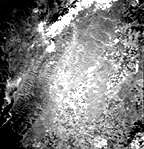 Comparisons of American and Brazilian farm sizes can be
made using the image left (
Comparisons of American and Brazilian farm sizes can be
made using the image left (