
|
|
Images to Work With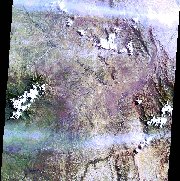 Satellite View
of Central Kenya in the Dry Season Here is a Landsat view of
Central Kenya. The resolution of this image is not great enough to show any dambos. However, it does show the general region of the
study area, which can be seen in the upper left of the next satellite image. The study
area is near two converging stream beds. Photo: Digital Imagery provided by Space Imaging EOSAT Satellite View
of Central Kenya in the Dry Season Here is a Landsat view of
Central Kenya. The resolution of this image is not great enough to show any dambos. However, it does show the general region of the
study area, which can be seen in the upper left of the next satellite image. The study
area is near two converging stream beds. Photo: Digital Imagery provided by Space Imaging EOSAT
Band 3 (0.63-0.69 µm) This band is in the red portion of the spectrum. A strong chlorophyll absorption band is located in the same portion of the spectrum. Consequently, this band is useful for discriminating between different vegetation types. The detected energy in this band is printed in this picture as the color red. Band 2 (0.52-0.6 µm) This band is in the green portion of the spectrum. The green reflectance peak of vegetation is found within the same portion of the spectrum. This band can be used to assess the health and vigor of plants. The detected energy in this band is printed in this picture as the color green. Band 1 (0.45-0.52 µm) This band is in the blue-green portion of the spectrum. Light within this spectral band penetrates deeper into water than the longer wavelength light of other Landsat spectral bands. Therefore, this band is useful for distinguishing features below the surface of water. It is also useful for distinguishing deciduous from coniferous plants, as well as for distinguishing soil from vegetation. The detected energy in this band is printed in this picture as the color blue.
Ground Truthing
Close-up Wet Season Image A close-up of the area during the wet season can help in the identification of dambos. See if you can find any areas that were identified as dambos by ground truth observations. This close-up view was taken within Landsat bands 4, 5, 1 represented as red, green, blue, respectively. These filters are used to bring out any vegetation features.
Band 5 (1.55-1.75 µm) This band is located in the middle infrared portion of the spectrum. It also measures reflected infrared radiation. The intensity of this band indicates the moisture content of the soil and the vegetation. This wavelength can penetrate thin clouds and is a useful discriminant between different vegetation types. The detected energy in this band is printed in this picture as the color green. Band 1 (0.45-0.52 µm) This band is in the blue-green portion of the spectrum. Light within this spectral band penetrates deeper into water than the longer wavelength light of other Landsat spectral bands. Therefore, this band is useful for distinguishing features below the surface of water. It is also useful for distinguishing deciduous from coniferous plants, as well as to distinguish soil from vegetation. The detected energy in this band is printed in this picture as the color blue.
[ Dambos ] [ Images to Work With ] [ Home ] [ Teacher Pages ] [ Modules & Activities ] |
![]()
HTML code by Chris Kreger
Maintained by ETE Team
Last updated April 28, 2005
Some images © 2004 www.clipart.com
Privacy Statement and Copyright © 1997-2004 by Wheeling Jesuit University/NASA-supported Classroom of the Future. All rights reserved.
Center for Educational Technologies, Circuit Board/Apple graphic logo, and COTF Classroom of the Future logo are registered trademarks of Wheeling Jesuit University.
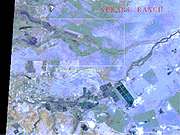 Image of the
Dambo Study Area This Landsat Thematic Mapper (TM) image shows
the dambo study area at Sukari Ranch. In this exaggerated true-color image, TM bands 3, 2,
and 1 are represented by the colors red, green, and blue respectively. Right: Remote sensing image of the dambo
study area. Photo: Digital Imagery provided by Space Imaging EOSAT
Image of the
Dambo Study Area This Landsat Thematic Mapper (TM) image shows
the dambo study area at Sukari Ranch. In this exaggerated true-color image, TM bands 3, 2,
and 1 are represented by the colors red, green, and blue respectively. Right: Remote sensing image of the dambo
study area. Photo: Digital Imagery provided by Space Imaging EOSAT Dambos Found by
Ground Observations
Dambos Found by
Ground Observations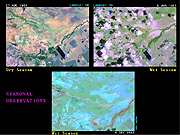 Images Taken at
Wet and Dry Seasons There is a substantial difference between
images of the study area taken during the dry season and those taken during the wet
season. The wet season causes the flooding of the dambos and the growth of more plant life
throughout the region. Right: Comparison
of dry and wet season images. Photo: Digital Imagery provided by Space Imaging EOSAT
Images Taken at
Wet and Dry Seasons There is a substantial difference between
images of the study area taken during the dry season and those taken during the wet
season. The wet season causes the flooding of the dambos and the growth of more plant life
throughout the region. Right: Comparison
of dry and wet season images. Photo: Digital Imagery provided by Space Imaging EOSAT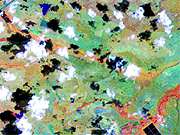 Band 4 (0.76-0.9 µm) This
band is located in the near infrared portion of the spectrum. It measures reflected
infrared radiation. It is useful for mapping shorelines and determining biomass content.
The detected energy in this band is printed in this picture as the color red. Left: Close-up view of area during the wet
season. Photo: Digital Imagery
provided by Space Imaging EOSAT
Band 4 (0.76-0.9 µm) This
band is located in the near infrared portion of the spectrum. It measures reflected
infrared radiation. It is useful for mapping shorelines and determining biomass content.
The detected energy in this band is printed in this picture as the color red. Left: Close-up view of area during the wet
season. Photo: Digital Imagery
provided by Space Imaging EOSAT