

FEATURED DATA
Ice Caps and Sea Levels
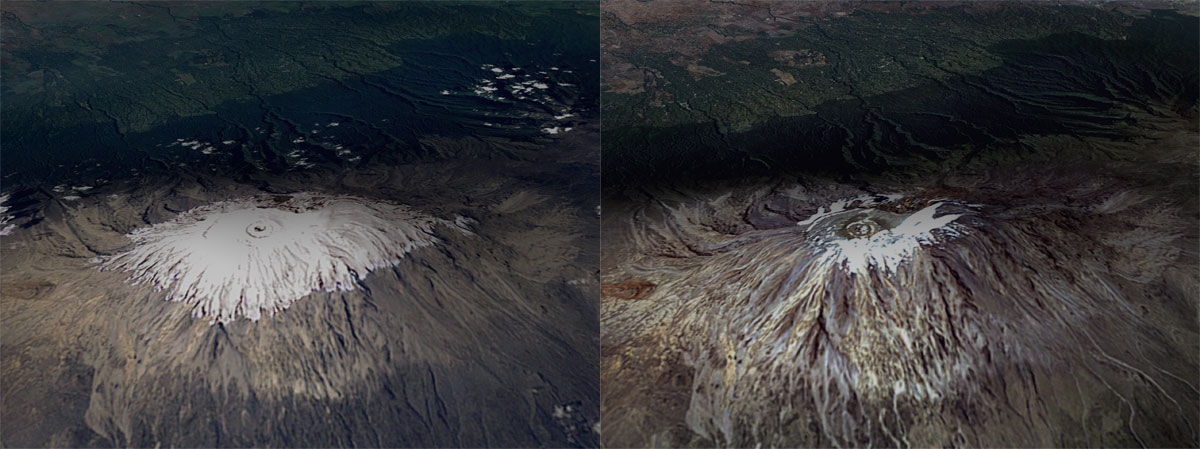
Mount Kilimanjaro, Africa
Mount Kilimanjaro in Africa. Left: Feb. 17, 1993. Right: Feb. 21, 2000. Kilimanjaro is the tallest freestanding mountain in the world and is made up of three volcanic cones. These before and after images show the dramatic decline in Kilimanjaro's icecap over recent decades.
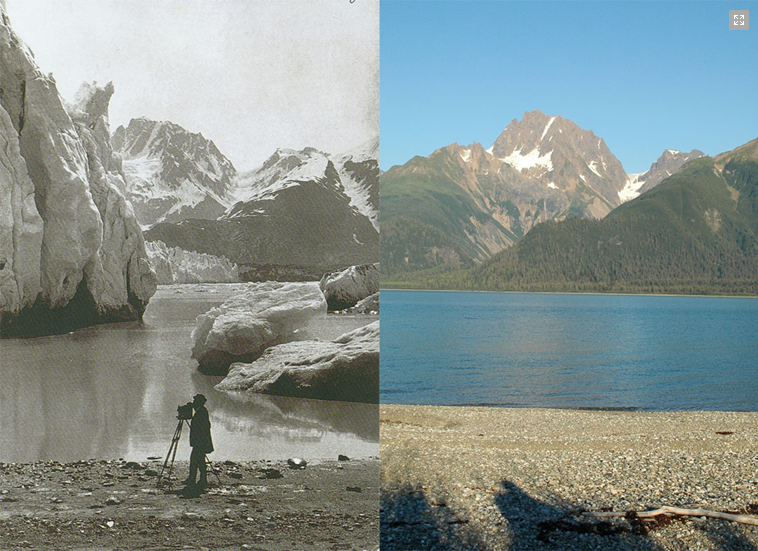
Muir Glacier, Alaska
Left: 1891. Right: 2005. This pair of photographs taken from the same location on the west shoreline of Muir Inlet, Glacier Bay National Park and Preserve in Alaska, shows the changes that have occurred to Muir Glacier during a period of more than a century. In the roughly 105-110 years between photographs, Muir Glacier has retreated more than 50 kilometers (31 miles) and is completely out of the field of view in the 2005 photograph.
Sources
http://www.usgs.gov/climate_landuse/glaciers/repeat_photography.asp
http://www.mnn.com/earth-matters/wilderness-resources/stories/8-before-and-after-images-of-ice-melt
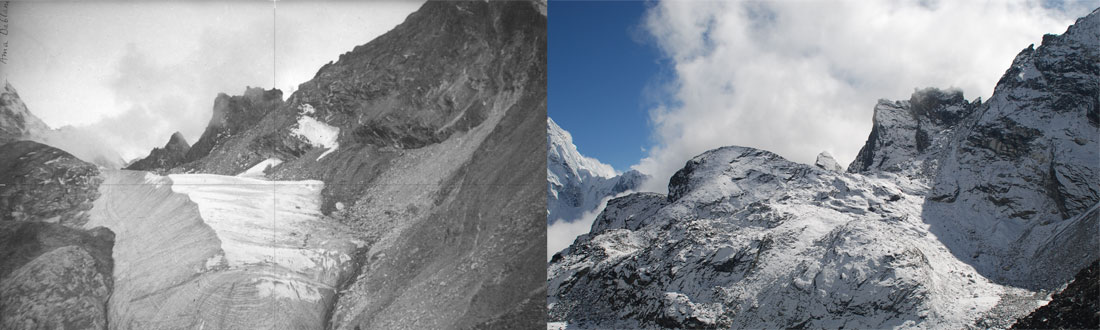
Pokhalde Glacier, Himalayas
Left: Autumn 1956. Right: Autumn 2007. At the foot of Mount Everest, Pokhalde Glacier as it appeared in the 1956 photograph has disappeared 50 years later, as shown in this photograph taken in 2007.
Sources
www.nepjol.info/index.php/HJS/article/download/979/1015
http://www.mountain.org/sites/default/files/Newsletter2008.pdf
http://www.democraticunderground.com/discuss/duboard.php?az=view_all&address=115x128411
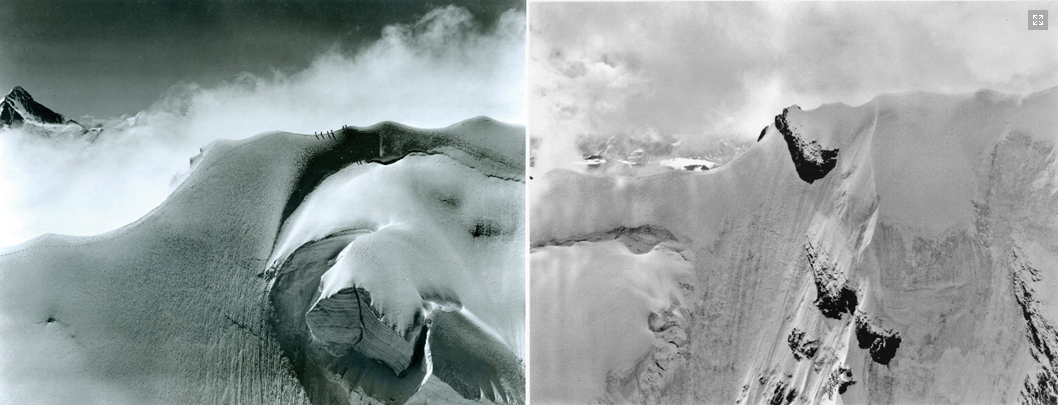
The Doldenhorn Mountain, North East Ridge, Switzerland
Left: July 24, 1960, 10:40 a.m. Right: July 27, 2007, 10:44 a.m. As captured in these before and after photos, the glaciers of the Swiss Alps have been in retreat in recent years, and experts are concerned that they eventually will disappear.
Sources
http://www.mnn.com/earth-matters/wilderness-resources/stories/8-before-and-after-images-of-ice-melt
http://www.huffingtonpost.com/2012/08/27/ice-melt-photos-greenland-alaska_n_1828979.html#slide=1427588
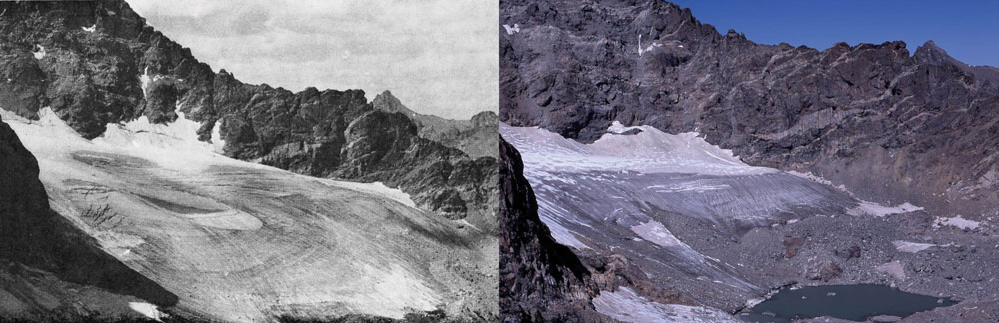
Arapaho Glacier, Colorado
Left: 1898. Right: 2003. This pair of photographs shows the retreat of the Arapaho Glacier in the Colorado Rocky Mountains between 1898 and 2003. The Arapaho is an alpine glacier that contributes to sea level rise through melting.
Sources
http://earthobservatory.nasa.gov/IOTD/view.php?id=5668
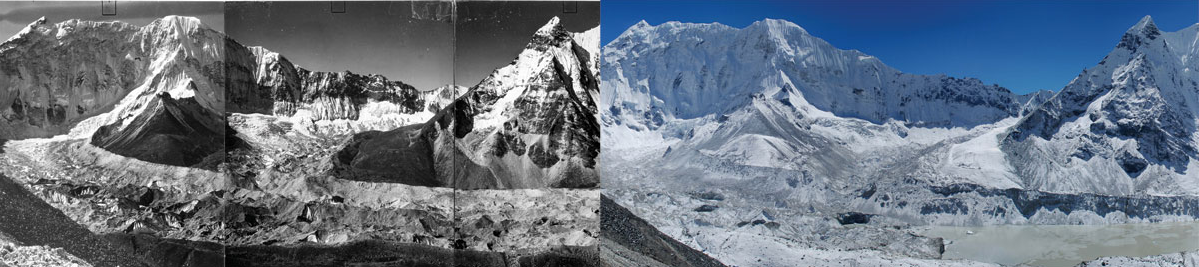
Imja Glacier, Himalayas
Left: Autumn 1956. Right: Autumn 2007. These images show the glacier as seen from a point above Amphu Lake and from the upper slopes of Island Peak. The after shot shows pronounced retreat and collapse of the lower tongue of the glacier and formation of new melt ponds.
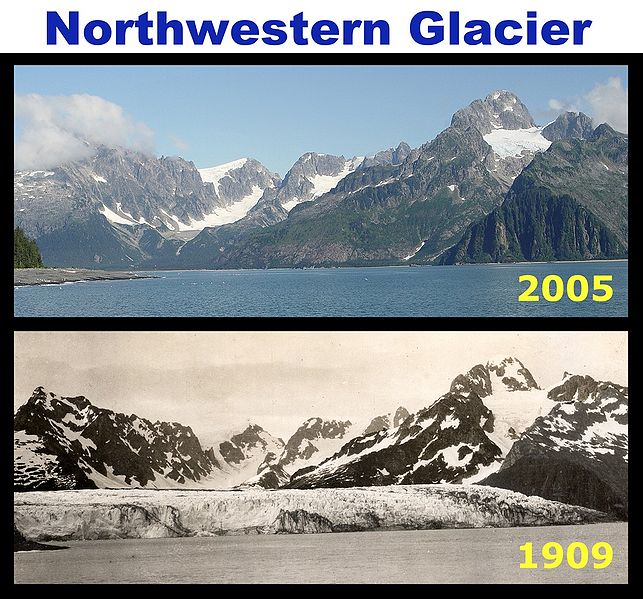
Northwestern Glacier, Kenai Fjords National Park, Alaska
The decline of Northwestern Glacier in Kenai Fjords National Park in Alaska. The glacier has retreated beyond the edge of the 2005 image.
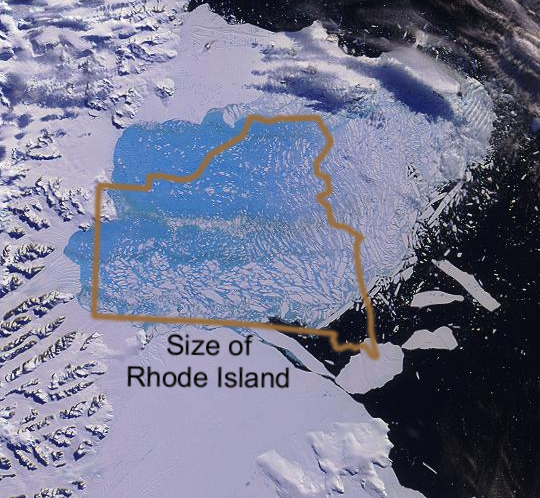
Larsen B Ice Shelf Collapse Size Comparison
A satellite image shows the 2002 breakup of the Larson B ice shelf in comparison to the size of the state of Rhode Island. The light blue color is a false color enhancement showing the region of breakup based on apparent temperature differences (measured in infrared wavelengths) of ocean water versus water previously under the ice shelf.
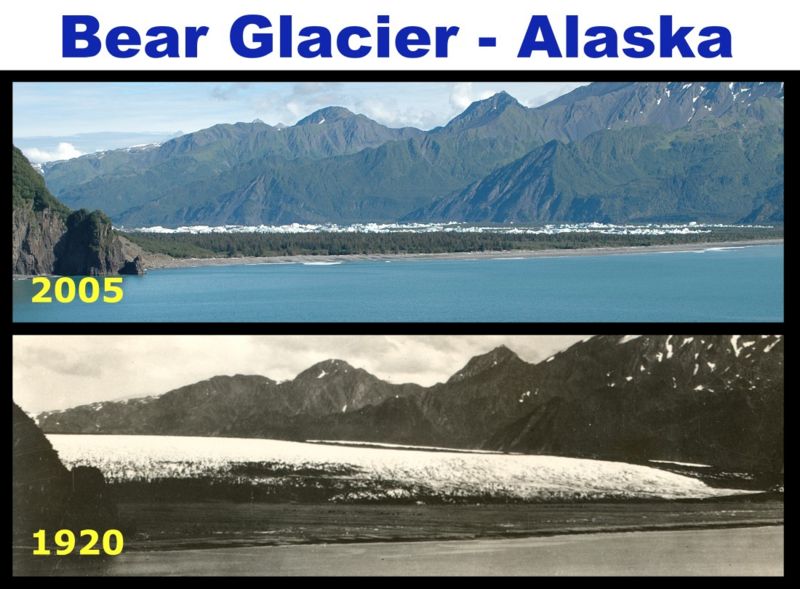
Bear Glacier, Alaska
The decline of Bear Glacier in Kenai Fjords National Park in Alaska. The shoreline appears different because it is subject to different tidal conditions and erosion.
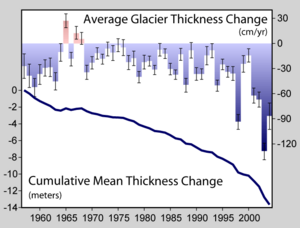
Average Glacier Thickness Change
This graph shows the decline in average thickness of mountain glaciers around the world.
White Chuck Glacier
Left: 1973. Right: 2006. White Chuck Glacier is located in the Glacier Peak Wilderness in the state of Washington. The glacier has retreated significantly since the end of the Little Ice Age. From about 1850 to 1930, the glacier thinned, and by 1940 it began to retreat quickly. In 15 years the glacier had three separate termini, and by 2005 the northern terminus was gone. Several small proglacial lakes have been left behind by the retreating glacier. Between 1958 and 2005 White Chuck Glacier lost more than half its surface area.
Source
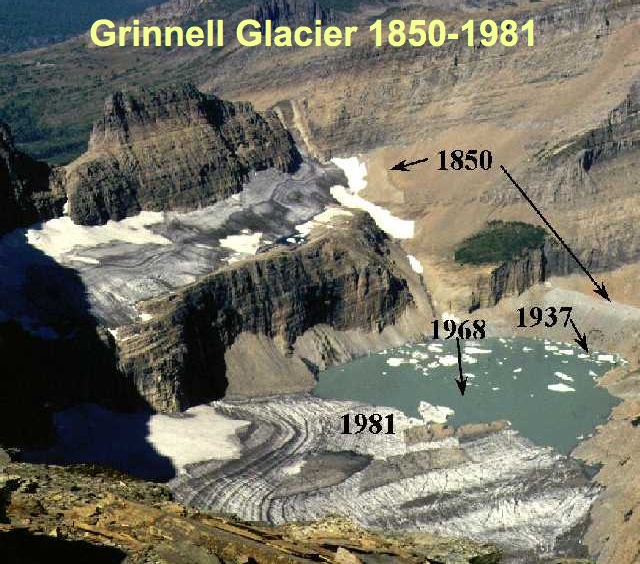
Grinnell Glacier 1850-1981
A 1981 aerial view of the Grinnel Glacier in Montana. The dates and arrows indicate the former extent of the glacier.
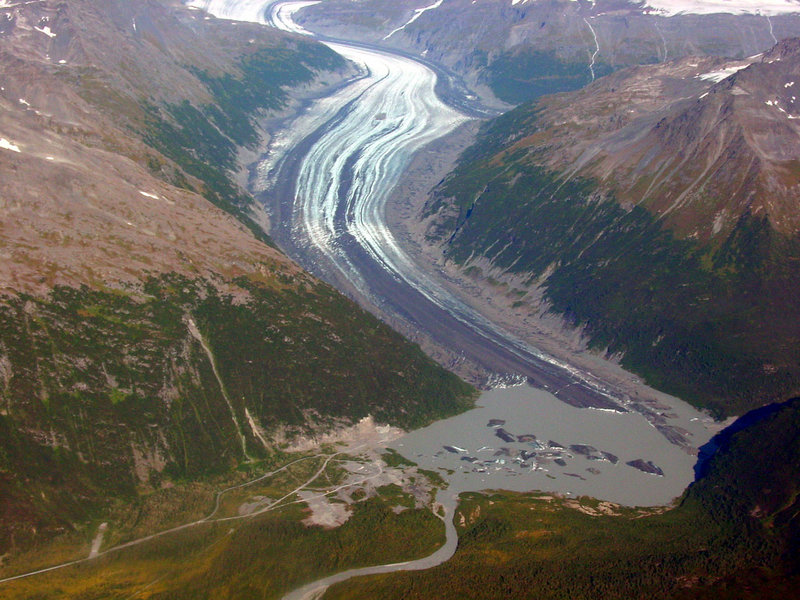
Valdez Glacier in Chugach Mountains, Alaska
North view of the terminus and lower reaches of Valdez Glacier, a rapidly thinning and retreating valley glacier located northeast of Valdez in the North Central Chugach Mountains in Alaska. Note the trimlines and the enlarging ice-marginal lake exposed at the margin of the glaciers. During the 20th century Valdez Glacier thinned by more than 300 feet.
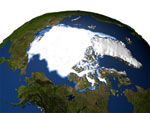
Arctic Ice Caps
Left: Sea ice in 1979. Right: Sea ice in 2003. Satellite data allow researchers to more clearly see Arctic changes and develop an improved understanding of the possible effect on climate worldwide.
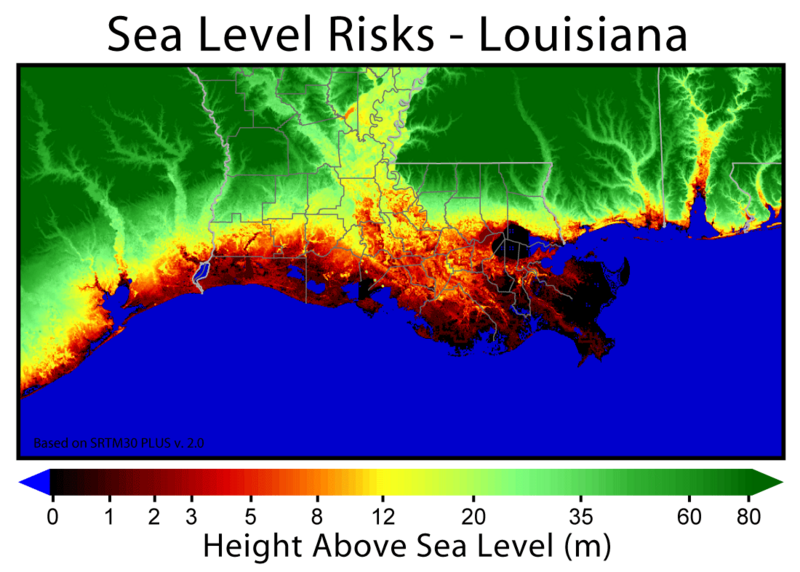
Louisiana and Gulf Coast Regions
This topographic map illustrates those areas along the Louisiana and Gulf Coast region that are near sea level and could, therefore, be vulnerable to future sea level rise.
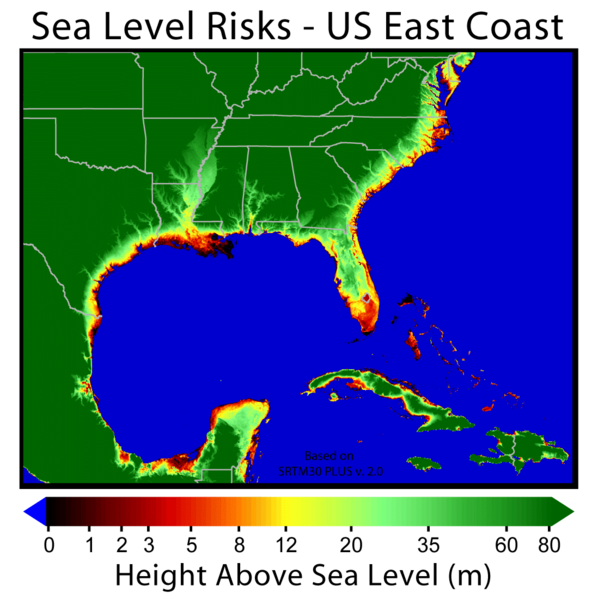
Sea Level Risks U.S. East Coast
This topographic map illustrates those areas along the U.S. East Coast that are near sea level and could, therefore, be vulnerable to future sea level rise.
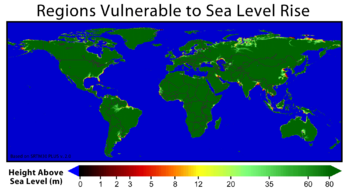
Regions Vulnerable to Sea Level Rise
This topographic map illustrates those areas globally that are near sea level and could, therefore, be vulnerable to future sea level rise.
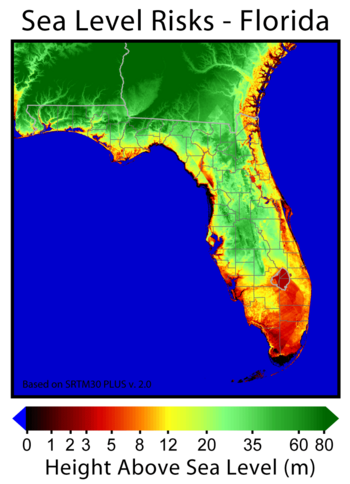
Sea Level Risks Florida
This topographic map illustrates those areas in Florida that are near sea level and could, therefore, be vulnerable to future sea level rise.
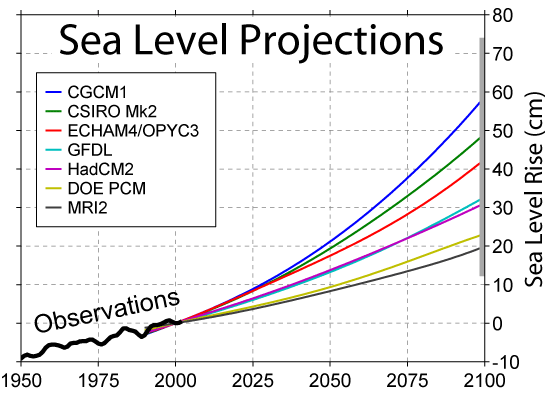
Sea Level Projections
The chart shows sea level rise from 1950 to 2000 and possible projections through 2100.
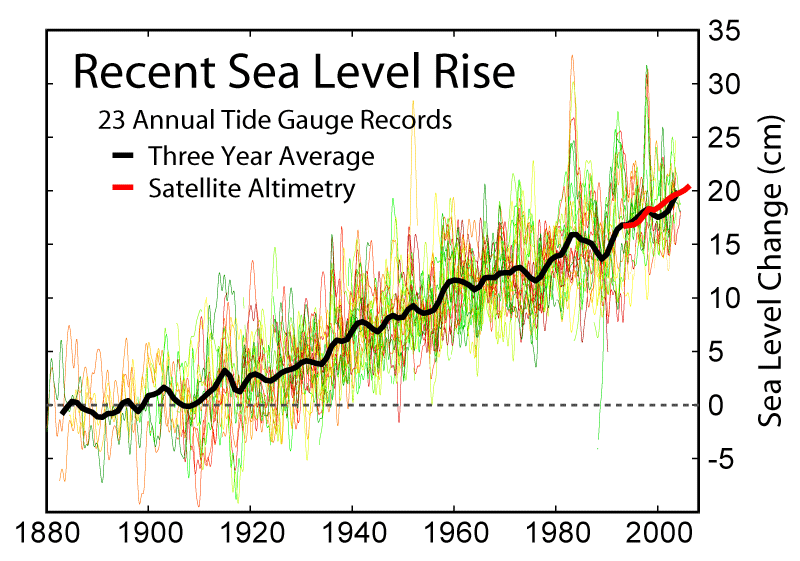
Recent Sea Level Rise
Graph of change in annually averaged sea levels at 23 tidal gauge sites. The thin black line is a three-year average from long-term records. The red line shows recent satellite altimetry data from TOPEX/Poseidon. There are fluctuations because of systematic error in the satellite records and/or incomplete sampling.
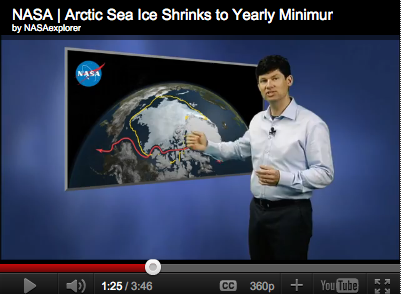
NASA Arctic Ice Research
Sea ice goes through this shrink-and-swell rhythm every year, but since consistent satellite observations began in 1979, both the annual minimum at the end of summer and the annual maximum at the end of winter continue to decline in area and thickness. Consistent with rising temperatures globally and specifically in the Arctic, climate scientists are concerned with this trend both as an indicator of climate change and as a feedback mechanism. As the white, highly reflective ice disappears, darker ocean waters appear. This darker surface absorbs more solar radiation and acts as a positive feedback to the warming that is already occurring and causing the change in the first place.
NASA's Cryosphere Program Manager, Tom Wagner, shared his take on Arctic sea ice with television audiences across the country. Watch this video online:
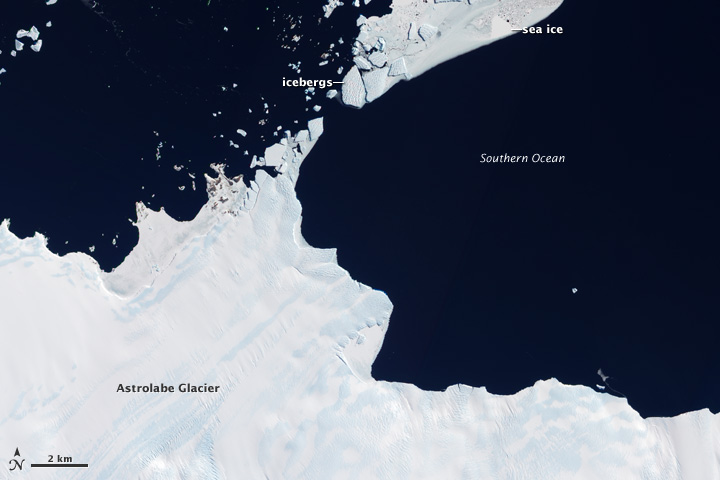
Astrolabe Glacier and Unbalanced Ice
Located in the Terre Adélie-George V Land section of East Antarctica, Astrolabe Glacier streams out from the interior of Antarctica to dump ice into the sea. This outlet glacier is estimated to be 10 kilometers (6 miles) wide, and the drainage basin that feeds it stretches as much as 200 kilometers (120 miles) inland. Astrolabe is named for the flagship of Captain Jules Dumont d’Urville’s 19th century expedition to Antarctica.
The Advanced Land Imager (ALI) on NASA’s Earth Observing-1 (EO-1) satellite captured this natural-color image of Astrolabe on Nov. 28, 2010, in late austral spring. Icebergs were breaking off from the glacier tongue—which extends from the coast like a shelf over the open water of the Southern Ocean—and running into sea ice. The calving front is roughly 7 kilometers (4 miles) wide, and scientists estimate that it loses half a cubic kilometer of ice per year.
The ice calving shown in this image is not necessarily unusual for the region or the time of year. But what is unusual is how much more calving all the glaciers of Antarctica and Greenland have been doing in the past two decades.
According to a NASA-funded satellite study, the Greenland and Antarctic ice sheets are losing mass at an accelerating pace and are overtaking ice loss from mountain glaciers and ice caps to become the dominant contributor to global sea level rise. Read more at the Earth Observatory presentation of this image.
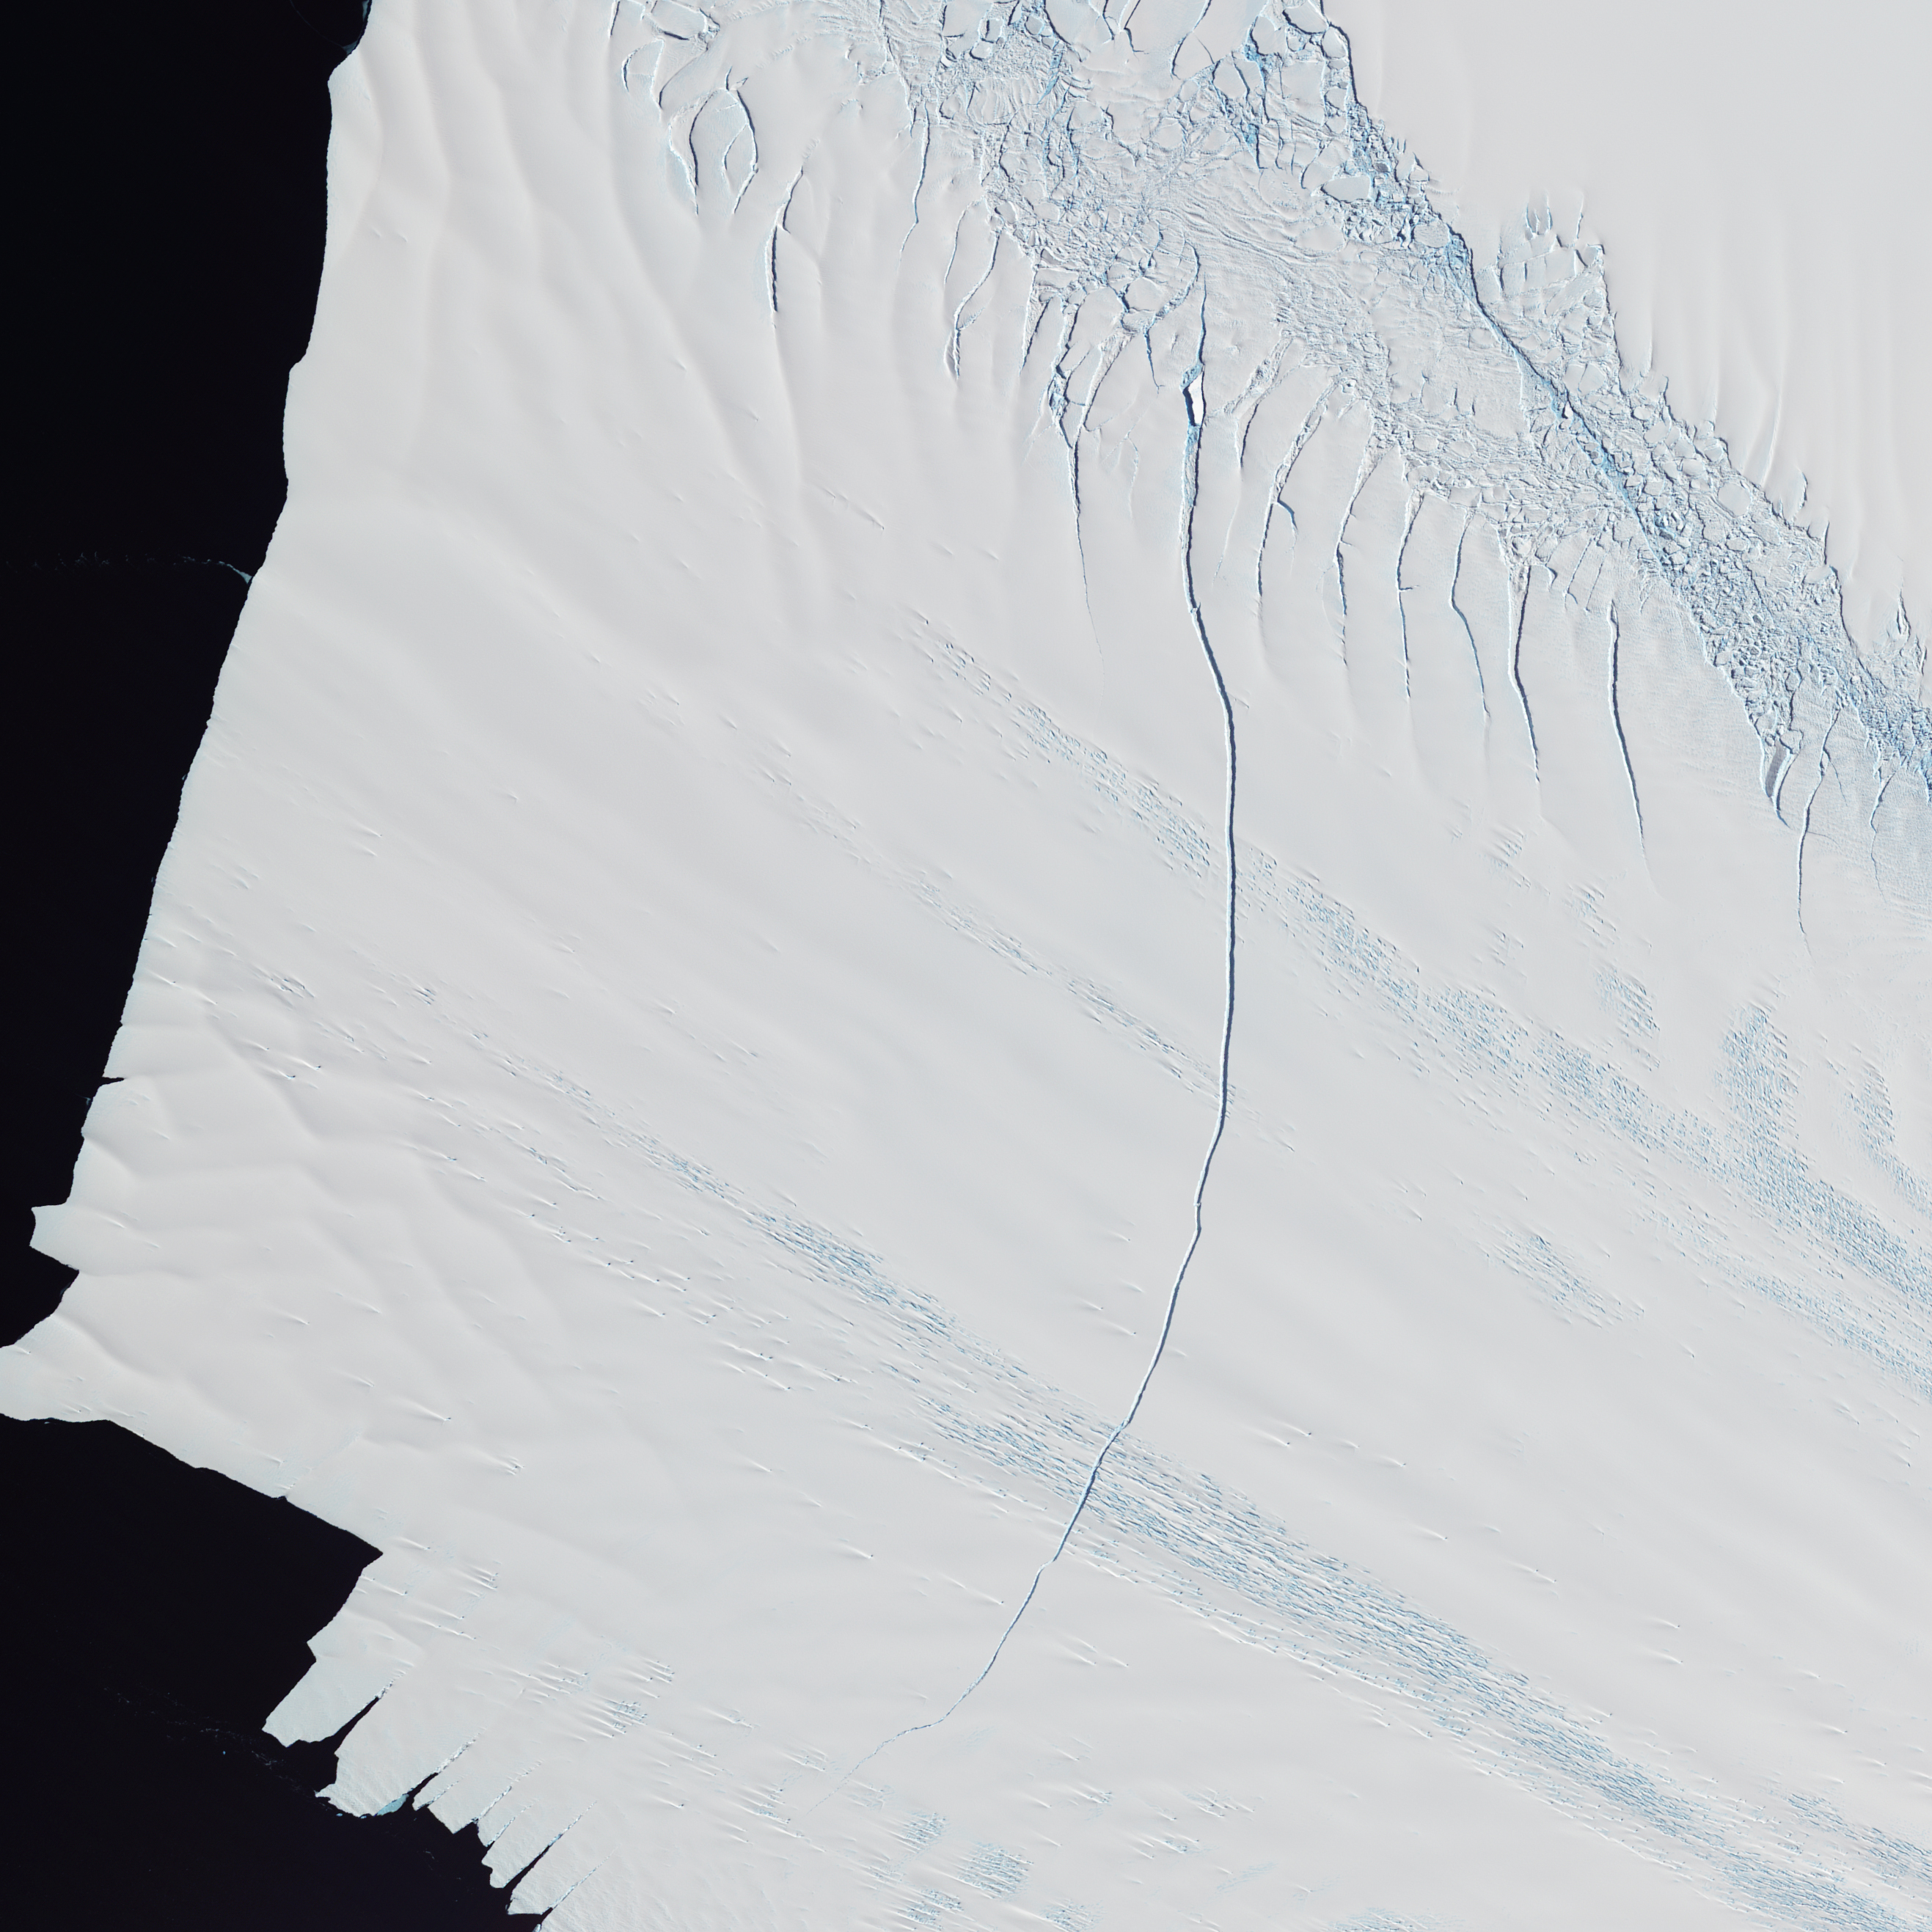
Crack in the Pine Island Glacier
In mid-October 2011 NASA scientists working in Antarctica discovered a massive crack across the Pine Island Glacier, a major ice stream that drains the West Antarctic Ice Sheet. Extending for 19 miles (30 kilometers), the crack was 260 feet (80 meters) wide and 195 feet (60 meters) deep. Eventually, the crack will extend all the way across the glacier and calve a giant iceberg that will cover about 350 square miles (900 square kilometers).
The Advanced Spaceborne Thermal Emission and Reflection Radiometer (ASTER) instrument on NASA’s Terra spacecraft acquired this image on Nov. 13, 2011. The glacier is textured, rough compared to the surrounding West Antarctic ice sheet. The Pine Island Glacier moves quickly, draining 100 meters of ice per year. The calving event shown here is natural. The last major calving event occurred in late 2000 and 2001 and was also imaged by ASTER.
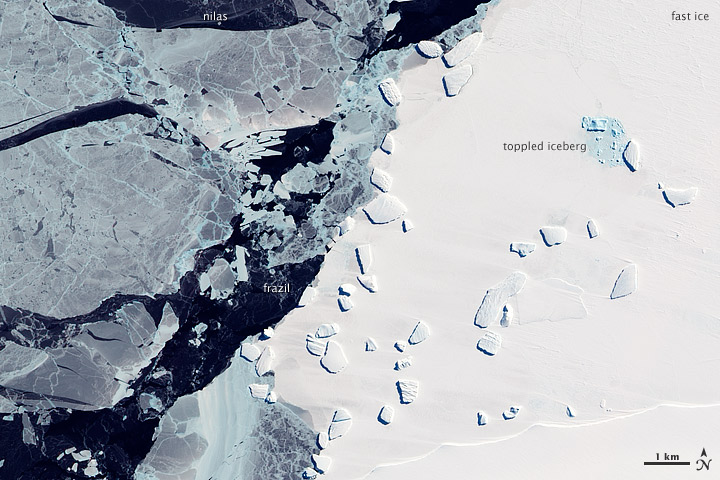
Sea Ice and Icebergs off East Antarctica
Though it is composed of frozen water, ice is hardly uniform. On Oct. 7, 2011, the Advanced Land Imager (ALI) on NASA’s Earth Observing-1 (EO-1) satellite captured this image of a variety of ice types off the coast of East Antarctica.
Brilliant white ice fills the right half of this image. It is called fast ice because it holds fast to the shore. This ice is thick enough to completely hide the underlying seawater, hence its brilliant white color.
Trapped within the fast ice and stuck along the edge of it are icebergs. They form by calving off ice shelves—thick slabs of ice attached to the coast. Ice shelves can range in thickness from tens to hundreds of meters, and the icebergs that calve off of them can tower over nearby sea ice. One iceberg, drenched with meltwater, has toppled and shattered (image, upper right). The water-saturated ice leaves a blue tinge.
The icebergs along the edge of the fast ice are likely grounded on the shallow sea floor, and their presence may help hold the fast ice in place.
Farther out to sea is pack ice that drifts with winds and currents. Much thinner than the fast ice, the translucent pack ice appears in shades of blue-gray.
The pack ice includes some newly formed sea ice. As seawater starts to freeze, it forms tiny crystals known as frazil (image, center). Although the individual crystals are only millimeters across, enough of them assembled together are visible from space. Constantly moved by ocean currents, frazil often appears in delicate swirls. Frazil crystals can coalesce into thin sheets of ice known as nilas (image, top). Sheets of nilas often slide over each other, eventually merging into thicker layers of ice.
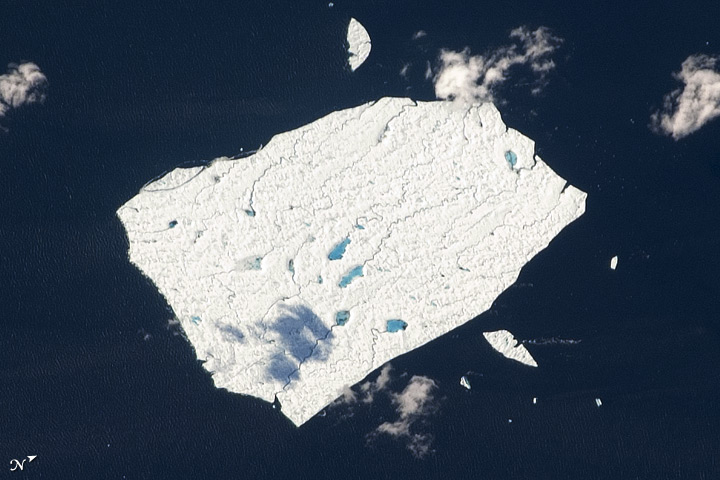
Melt Ponds, Petermann Ice Island
Petermann Ice Island drifts in the North Atlantic off the shores of Newfoundland, Canada. Once a hunk of ice fives times the size of Manhattan Island, the ice island has splintered several times since it dropped off the edge of Greenland's Petermann Glacier in August 2010. Yet still it behaves a bit like the massive ice sheet it left.
Astronauts on the International Space Station used a digital camera to capture this view of Petermann Ice Island A, fragment 2, off of the northeast coast of Newfoundland on Aug. 29, 2011. Spanning roughly 4 kilometers by 3.5 kilometers (2.5 by 2 miles), the ice island is covered with melt ponds and streams, much as the surface of Greenland looks in mid-summer.
As ice melts on top of the Greenland ice sheet, the meltwater forms streams and pools in the depressions on the ice surface. Drawn downslope by gravity—much like streams on a mountainside—water also runs toward the edges of the ice. In some cases it cracks through it and rushes to the bottom. Such processes appear to be at work on the ice island as well.
August 2011 was a busy month in the life of the ice island, according to the Canadian Ice Service. On Aug. 7 it became grounded on a shoal or shallow seafloor off of St. Anthony, Newfoundland, where it sat for 11 days. By Aug. 18 the ice island broke free and began drifting again, only to split into two large pieces about five days later.
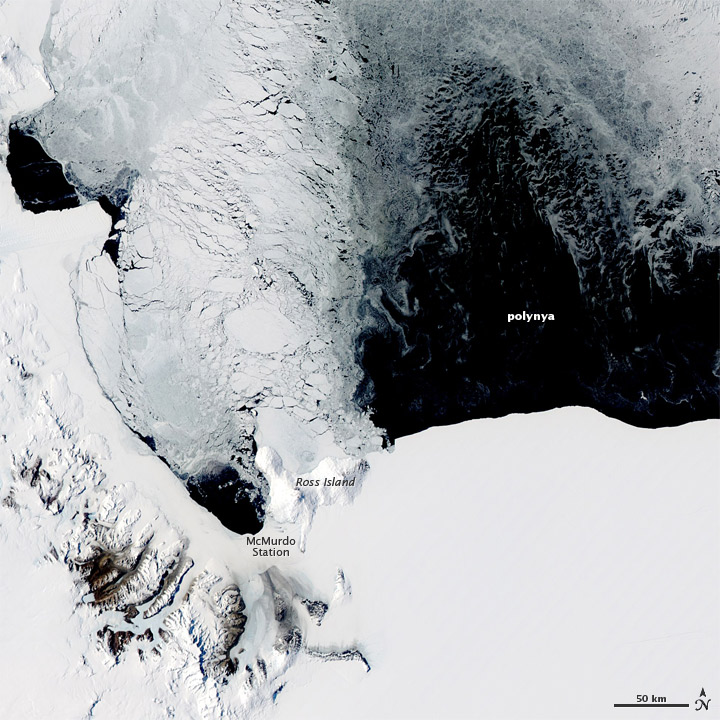
Polynya off the Antarctic Coast
Winter conditions in the Arctic and Antarctic lead to the formation of sea ice. But in some places where sea ice should occur, open water appears instead. Persistent areas of open water amidst sea ice are known as polynyas. Often the result of the upwelling of warm ocean water, polynyas can also result from winds.
The Moderate Resolution Imaging Spectroradiometer (MODIS) on NASA’s Aqua satellite captured this natural color image of a polynya off the coast of Antarctica, near Ross Island and McMurdo Station on Nov. 16, 2011. The polynya was likely caused by katabatic winds, which derive their name from the Greek term for “descent.” The winds blow off Antarctica’s high interior toward the ocean and can attain hurricane strength—up to 200 miles (320 kilometers) per hour.
Strong winds have pushed sea ice away from the coast in this image, but not uniformly. Ross Island and the mountains to the west block some winds, so sea ice lingers near those landforms. Along the lower elevation area east of Ross Island, winds clear the ice from a large stretch of ocean. North of the polynya, sea ice shows varying degrees of thickness, perhaps the result of alternating windy and calm spells.
Polynyas, ice shelves, and sea ice were prime targets for IceBridge, a NASA mission in 2011 that used airplanes equipped with radar and lidar to develop a three-dimensional view of Antarctic ice. You can learn more about the mission in IceBridge: Building a record of Earth’s changing ice, one flight at a time.
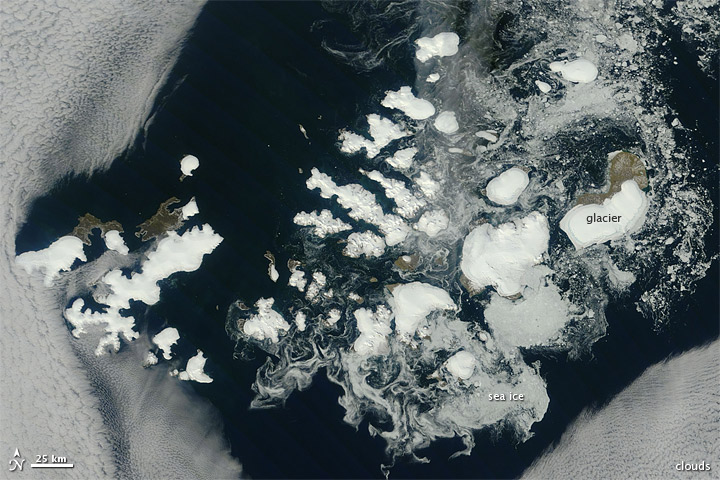
Franz Josef Land
Russia’s northernmost territory, Franz Josef Land, is an archipelago of 191 islands in the northeastern Barents Sea. On Aug. 17, 2011, clear skies allowed the Moderate Resolution Imaging Spectroradiometer (MODIS) on NASA’s Terra satellite this unobstructed view.
Clouds fringe this natural-color scene, like curtains held back from a window. Around the islands sea ice forms serpentine shapes of light gray and dull white. The glaciers that cap many of the islands are bright white. In ice-free areas land cover is pale brown, typical of tundra.
Situated about 1,000 kilometers (625 miles) from the North Pole, Franz Josef Land has a punishing climate. The average summertime temperature is just 35 degrees Fahrenheit (2 degrees Celsius), and the average wintertime temperature is -8 degrees Fahrenheit (-22 degrees Celsius). Vegetation includes lichens, mosses, and Arctic flowering plants.
The archipelago is comprised of marine deposits built into low-lying islands. Although some studies have dated the rocks to the Mesozoic Era (the Age of Reptiles), fossils in coal deposits from the eastern reaches of Franz Josef Land suggest that the rocks might be even older.
Geologic processes of uplift and erosion have shaped Franz Josef Land since the time of the dinosaurs. During the Jurassic Period about 206 to 144 million years ago, the islands experienced uplift and might have been a single landmass. Soon after the area was uplifted, it began to erode. But the erosion was uneven—most intense along the archipelago’s eastern and western margins and less intense in the center.
During the Cretaceous Period about 144 to 65 million years ago, large-scale seismic activity coated parts of Franz Josef Land with volcanic rock. In more recent times ice has shaped the archipelago. Beginning about 1.8 million years ago, massive ice sheets advanced and retreated over the Northern Hemisphere, grinding and shaping the land surface. Although ice sheets have retreated, glaciers have remained, coating much of this archipelago in icy white.
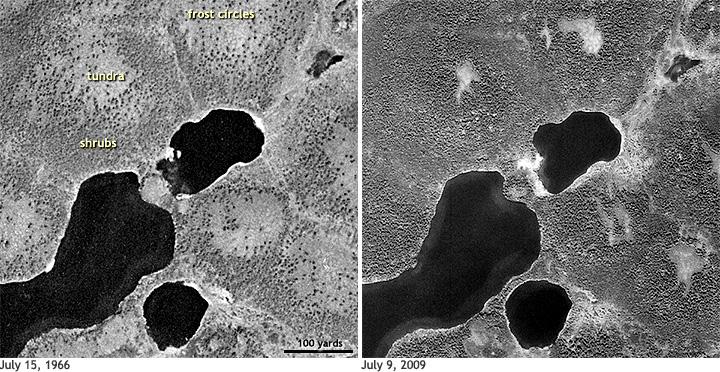
Migrating Siberian Shrubs
In the 2011 Arctic Report Card scientists concluded that the Arctic environment has undergone a fundamental shift in conditions. Recent years—warmer, greener, less icy—are likely the new normal for the Far North. One sign of the Arctic’s ongoing transformation is the spread of shrubs across the tundra.
The pair of images above shows a site on the Siberian tundra near Russia’s Yennisey River as it appeared in the summers of 1966 (left) and 2009 (right). The left image is from Gambit, a declassified spy satellite, and the right image is from GeoEye-1, a commercial satellite. In the 43 years between images, shrubs colonized virtually all the previously open tundra around a cluster of lakes. The images are from a study done by Gerald Frost, a Ph.D. student at the University of Virginia.
The conversion of tundra to dense shrubland triggers a cascade of changes in how the ecosystem functions. Observations from Europe, Alaska, and Siberia in recent decades have shown plant communities became less diverse as mosses, lichens, and other low-growing plants disappeared under the shade of shrubs. The loss of lichens, in particular, could pose a problem for caribou and reindeer, which forage on them extensively.
The change from tundra to shrubland can also affect the thawing of permafrost. In the winter shrubs trap snow, and the insulating effect can make the soil temperature up to 30 degrees Celsius warmer than the air temperature. In the summer, though, the shrubs provide shade, which tends to keep soil temperatures in shrub-covered areas cooler than those in open tundra.
Whether the arrival of shrubs will accelerate permafrost melting or slow it will depend on whether the summer cooling or the winter warming is stronger. The outcome of the competing influences has global implications: Thawing permafrost has become another source of atmospheric carbon dioxide, the most important long-lived greenhouse gas.
Read more at Shrub Takeover One Sign of Arctic Change in NOAA’s ClimateWatch Magazine.
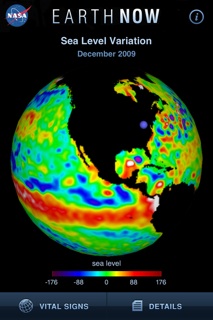
Earth Now: Sea Level
NASA's Earth Now is an application that visualizes recent global climate data from Earth science satellites, including surface air temperature, carbon dioxide, carbon monoxide, ozone, and water vapor as well as gravity and sea level variations. Data sets are visually described using "false color" maps. Color-coded legends are provided to indicate relative strength or weakness of an environmental condition. The resulting 3-D model of the Earth may be rotated by a single finger stroke and may also be zoomed in or out by pinching two fingers. It was developed by the Earth Science Communications and Visualization Technology Applications and Development Teams at NASA's Jet Propulsion Laboratory, with support from NASA headquarters.
Link to app: http://itunes.apple.com/us/app/earth-now/id494633346?mt=8
